The media’s coverage coverage of these statistics has been muted. Although entirely ligitimate, the rich are a miniscule minority of the country, where the government feeds 800 million citizens It is an inconvenient contradiction to face, in the midst of the largest electoral exercise in the world.
Rising divide
The release of the report was almost synchronous with the release of the India Employment Report 2024. It brought out the unemployment situation in the country which is more distressing than what has been imagined so far. To paraphrase couple of the key findings that should worry the political establishment and policy makers- ‘employment in India is predominantly self-employment and casual employment. Nearly 82 per cent of the workforce engages in the informal sector, and nearly 90 per cent is informally employed. Due to the nature of employment growth since 2019, the share of total employment, which is in the informal sector, real earnings also declined after 2019. Overall, wages have remained low. As much as 62 per cent of the unskilled casual agriculture workers and 70 per cent of such workers in the construction sector at the all-India level did not receive the prescribed daily minimum wages in 2022.’
And of equal if not greater concern, should be the findings brought out in the report released a fortnight earlier by a team of economists working with World Inequality Lab, on the income and wealth inequality in India titled as, ‘The Rise of the Billionaire Raj.’ This study is conducted periodically, covering various countries. The India report has been compiled by combining the national income accounts, wealth aggregates, tax tabulations, rich lists and surveys on income, consumption and wealth in a consistent framework to present long run homogeneous series of income and wealth inequality in India.
Divisions amongst the rich is also wide
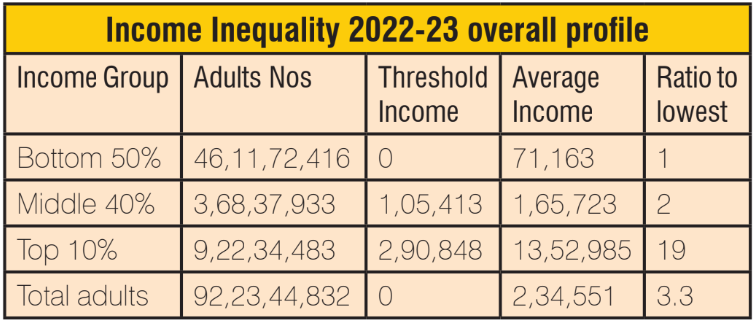
The stark reality of the income inequality exhibited by dissecting the national income of the year 2022-23 across different income strata, pithily brings home the issue. The adult population of 92.23 crore is categorised under three heads being, the bottom 50 per cent, the top 10 per cent and the middle 40 per cent.
Even at the top 10 per cent level, the threshold income is quite low at Rs 290,848 per annum. This implies that only 10 per cent of the adults in this country earn more than Rs 24,238 per month!
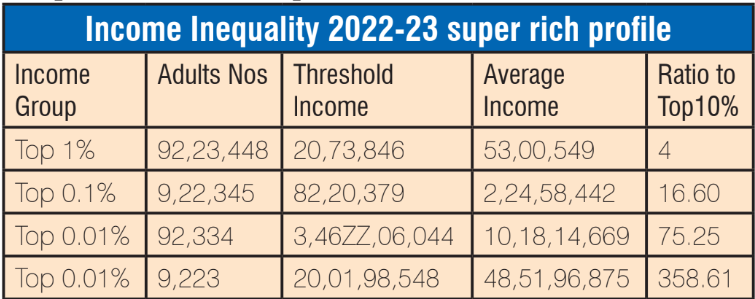
The table below breaks down the richest class into subdivisions demonstrating the distance each lower subdivision has from its predecessor. Even among the richie rich, there is enough room for the top 1 per cent to complain of the injustice of income inequality, as the curve steepens in its travel upwards!
Rs 20.74 lakh per annum, being the threshold level for the top 1 per cent is actually surpassed in the recent campus placements at IIM-Rohtak and IIM -Bengaluru with the median salaries of Rs 19.27 lakh and Rs 32.5 lakh, respectively! These newly minted graduates with little experience of managing anything will be part of the 1 per cent of the earning population of the country, underscoring how a tiny sliver of the society stands privileged due to certain social background and access to a particular type of education.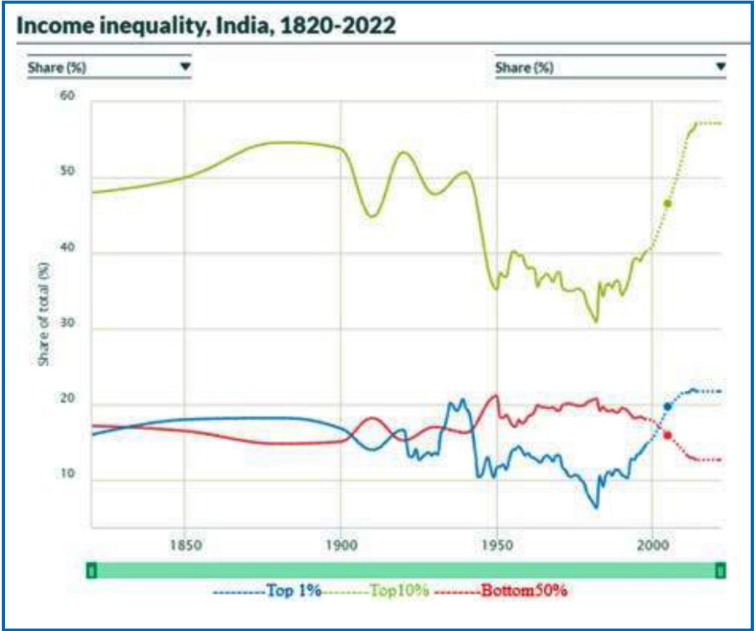
The data available with the World Inequality Lab captures the movement in inequality over not just a few years, but two centuries to be precise! The difference between the top 1 per cent and the bottom 50 per cent which was almost 10 percentile points in favour of the latter in 1950, exactly reverses in less than seven decades’ time such that the top 1 per cent has income which is nine percentile points more than the bottom 50 per cent!
While the top 1 per cent owns 21.7 per cent of the total national income, the top 0.1 per cent owns almost 10 per cent of the national income demonstrating the skewness in the income distribution even at the highest possible level.
International reports are often debunked
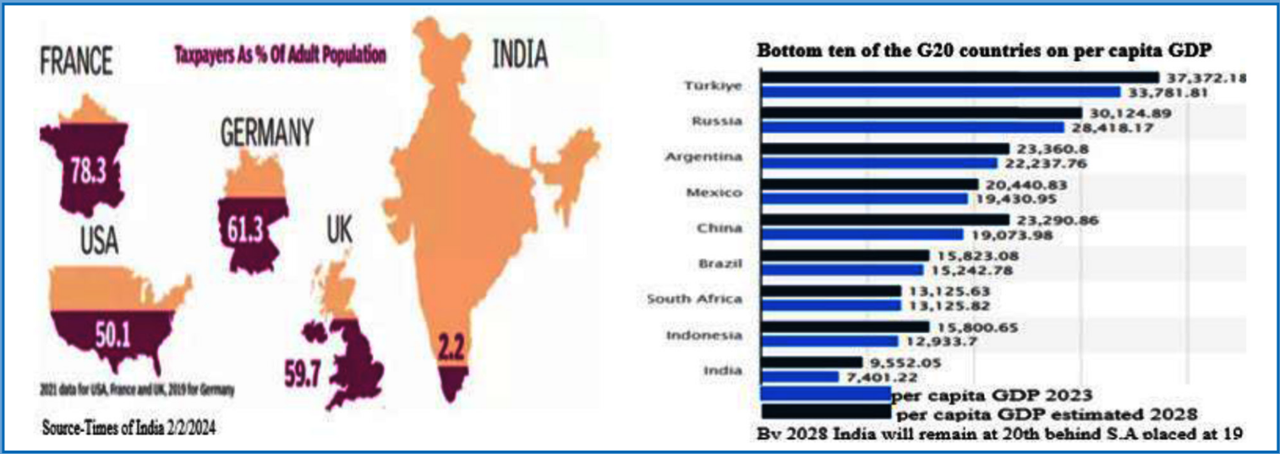
However, the tax collections are nowhere reflective of the concentration in the income. The most recent data available on the effective tax rate and the income declared across tax payers offer little comfort on the Laffer curve working in the Indian context. India stands on the horns of a paradox. A lion’ share of its national income is cornered by a tiny fraction of the population. Its effective tax payer base is very low as shown in comparison to a few other countries in the picture below. It also has the problem of a low per capita GDP that will continue into the coming years as shown in comparison with peer countries that constitute the bottom ten of the G20.
While the graph shows the figure in PPP terms, the actual per capita GDP growth in India in the ten-year period (1994 -2004) went from USD 346 to USD 624 at 6.1 per cent CAGR. In the decade of 2004-14 (termed by the current Union FM as a wasted decade) it grew by 9.6 per cent CAGR ($624 to $1560), and in the eight years between 2014 and 2022 at 5.6 per cent CAGR ($1560-$2411).
While in absolute growth terms we are often credited as the fastest growing major economy, it may be important to check the per capita GDP growth in USD terms if we qualify as that. Between 2014-2022, our small neighbour, Bangladesh, grew at 11.71 per cent with per capita GDP rising from USD 1108 to USD 2688. And China, whose growth supposedly slipped greviously, managed to increase per capita GDP by a CAGR of 6.6 per cent rising from USD 7636 in 2014 to USD 12,720 in 2022.
The divergence in the income inequality has been the highest in the last two decades or so. There is scarcely any official recognition of the issue. None of the Economic Surveys or the union budget speeches delivered in this period make even a nodding acknowledgement of the issue. There were four different union FMs in office during the twenty year period.
Whenever any international agency puts out such studies, it is officially debunked as lacking in thoroughness in methodology or faulted for basing the findings on inaccurate data. If such is the conviction, the official machinery should come up with a credible local exercise that forms the avenue for further debate among the right experts.
PS: The article is written with the help of data in the public domain and it has not been independently vetted or peer reviewed. If any error is noticed or any question arises, the same may be communicated.