The period since 2004 has seen merely two prime ministers helm the nation; and just four finance ministers presented nineteen full budgets.
Is there a substantive and philosophical divergence in the economic administration over this period and can any particular FM lay claim to be an out-performer?
A period of almost two decades is neither too long nor too brief in-as-much as it would encompass different business and economic cycles and straddle a good sprinkling of positive and adverse developments globally to serve as a representative era to derive some discernible pattern to answer the above question.
The years between 2004 and the present can be conveniently split into four blocks being 2004-9, 2009-14, 2014-19, and the four years under the present government with the same incumbent heading the finance ministry with just one more budget to go.
 The five years that preceded, being the first term in office of the BJP under Modi that was returned an absolute majority in the Lok Sabha, were steered by the late Arun Jaitley as finance minister.
Interestingly, the preceding ten years (2004-14) also witnessed a single head of the government though with support from different coalition constituents and just two finance ministers who between them shared ten full budgets!
 P Chidambaram who as a member in the Rajya Sabha actively engages in the debate on fiscal matters and not someone to take any criticism lying down, presented six budgets and the late Pranab Mukherjee did four from 2009 to 2012.
Is there any marked distinctiveness in the key levers these captains of the North Block operated to achieve a particularly differentiated outcome? This is not easy to evaluate in qualitative terms on specific outcomes. Hence the analysis is attempted with the help of certain key budget markers.
SIX KEY FACTORS…
The factors taken for comparison are the six key numbers.
Revenue receipts are the starting point for any budgeting exercise as the ability to spend is contingent on the inflow. Higher revenue receipts are a distinct sign of good budgeting.
Capital receipts lack consistency and aspects like disinvestments are not easy policy measures for any government to implement with regularity and hence kept out.
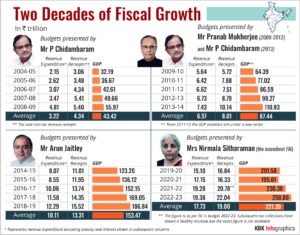
Table no 1: 2004-2009 All budgets presented by P Chidambaram
| FY (Rs tn) | Subsidy | Interest | Capex |
| 2004-05 | 0.46 | 1.25 | 1.19 |
| 2005-06 | 0.47 | 1.30 | 0.69 |
| 2006-07 | 0.53 | 1.46 | 0.75 |
| 2007-08 | 0.70 | 1.71 | 1.21 |
| 2008-09 | 1.23 | 1.92 | 0.90 |
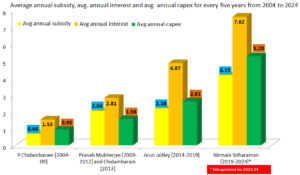
| Average | 0.68 | 1.53 | 0.95 |
The next indicators are capital expenditure, subsidy and the rest of the revenue expenditure. A higher capex is a positive factor but on the other hand subsidy and the rest of the revenue expenditure may be contentious for the quality factor. But given the political ground realities, both need to be viewed as positive factors though by weights being ascribed put on a lower pedestal as compared to capex.
Table no 2: 2009-2012 by Pranab Mukherjee and 2013 by Chidambaram
| FY (Rs tn) | Subsidy | Interest | Capex |
| 2009-10 | 1.34 | 2.13 | 1.12 |
| 2010-11 | 1.64 | 2.34 | 1.56 |
| 2011-12 | 2.11 | 2.73 | 1.58 |
| 2012-13 | 2.57 | 3.13 | 1.67 |
| 2013-14 | 2.54 | 3.74 | 1.87 |
| Average | 2.04 | 2.81 | 1.56 |
The fifth indicator of interest is clearly an area which needs to be marked negatively and a higher outflow is a sign of weakness.
An obvious omission is the deficit! These have no life of their own and are a derivative of the revenue less expenses and both are well factored in the exercise.
THE COMMON MEASURE – PERCENTAGE OF GDP
The numbers falling in different time periods cannot be matched without converting them into some common measure. For example, the interest paid in the period 2004-09 cannot be compared directly to the period say 2019-2024. To make the numbers comparable across a long period of time, these indicators are expressed as a percentage of the GDP of the relevant period. To make this mathematically logical, the average of each of these items is computed for each block of five years and expressed as a percentage of the GDP.
Table no 3: 2014-2019 All budgets by Arun Jaitley
| FY (Rs tn) | Subsidy | Interest | Capex |
| 2014-15 | 2.58 | 4.02 | 1.97 |
| 2015-16 | 2.41 | 4.41 | 2.53 |
| 2016-17 | 2.04 | 4.80 | 2.86 |
| 2017-18 | 1.91 | 5.29 | 2.63 |
| 2018-19 | 1.96 | 5.82 | 3.07 |
| Average | 2.18 | 4.87 | 2.61 |
The serendipity of this exercise is that each block is actually represented by one FM; only, the period 2009-14 had Pranab Mukherjee present the first four and Chidambaram the fifth.
A question may arise why only these four periods and why not the period of 1991-96 when Dr Manmohan Singh, considered the prime architect of economic reforms presented his five budgets.
Theoretically, the exercise can even extend to the time of Morarji Desai who almost presented all the budgets in the decade of 1960s! However, the order of magnitude of the numbers involved are so vastly different that while comparability is managed by using the GDP of the relevant time period as the basis, the purpose is lost with actions in completely different eras being vastly dissimilar in terms of the critical underpinnings and compulsions that inform the budget exercise.
Table no 4: 2019-2022 by Nirmala Sitharaman
| FY (Rs tn) | Subsidy | Interest | Capex |
| 2019-20 | 2.28 | 6.12 | 3.35 |
| 2020-21 | 6.89 | 6.82 | 4.24 |
| 2021-22 | 4.26 | 8.13 | 6.04 |
| 2022-23 | 3.16 | 9.40 | 7.50 |
| Average | 4.15 | 7.62 | 5.28 |
N A Palkhivala, the most followed commentator on the Union budgets rendered his last speech in 1995 when the GDP was Rs 8.43 tn and for comparison the interest payment projected in the budget 2023 is itself Rs 9.40tn!
 The average GDP during 1991-96 was Rs 7.71 tn and the figure is grown well over 30 times since!
How comparable the performance of Virat Kohli with that of Everton Weekes though both played virtually the same sport!
GET YOUR SNOW WHITE!
Just as the FMs have a great ability to twist and tweak the numbers to tell the story they desire, you can make your own version of the arithmetic to get your SNOW WHITE!!
In trying to get the final answer as to who on an overall basis has been the better as FM it is necessary to get a single number for each of them. While it can be done by a simple aggregate score of the final averages given in Table 5 it may not be the best approach.
It may be important to bring some subjectivity into the exercise as beauty often lies in the eye of the beholder. This can be facilitated by giving weights.
Table no 5: Average of all FOUR periods converted a per cent of average GDP of the relevant period
| Block period | Rev exp % GDP | Subsidy % GDP | Interest % GDP | Capex % GDP | Rev receipts % GDP | GDP growth* |
| 2004-09 | 7.4 | 1.56 | 3.52 | 2.19 | 10.70 | 34.9 |
| 2009-14 | 7.5 | 2.33 | 3.21 | 1.78 | 9.16 | 35.8 |
| 2014-19 | 6.6 | 1.42 | 3.17 | 1.70 | 8.67 | 24.6 |
| 2019-22 | 8.0 | 1.87 | 3.44 | 2.38 | 8.58 | 16.2# |
* GDP growth represents the growth between the first year of the block and the average of the said block. For example, 2004-05 GDP compared to the average of 2004-09 figure and so on.
# Since the 5-year period is not over the average is worked out by assuming growth of 11 per cent in 2024 by taking the 2023 figure as Rs 258 tn.
An example would be to give a weight of 5 for receipts, 4 for capex, 0.5 for each the subsidy and general revenue expenses. A negative weight of -5 may be assigned to interest payments.
If there is a tie, use the GDP growth factor in the last table to break it!
Happy hunting to find your favourite FM.
And DIY!!!
*****