Despite the exhibition of camaraderie and bonhomie on public platforms, the state and the union functionaries are often at loggerheads on the issue of sharing of resources, and the support the state receives in terms of fiscal transfers. This is often brought forward by states that are not ruled by the party at the centre, BJP.
While inaugurating the airport in Trichy, the PM had said that Tamil Nadu has received a far higher amount from the centre as fiscal transfers during the past decade as compared to the preceding ten years, when a different coalition was in power.
Let’s do the math
 While the political rhetoric has its own spin and context, the said claim did act as a spur to look at some facts relevant to TN, without limiting to the sole aspect of the transfer from the center to the state.
However, the analysis is not on the pre 2014 and the post 2014 periods which is a political watershed, but on a comparison of the period of six years prior to the introduction of GST in July 2017, which marked a foundational change in the tax structure of the country, and the period since the advent of the GST regime. The three fiscal years 2011-12 to 2013-14 included in the analysis in some manner represent the regime prior to May 2014 to enable some comparison though it is not comprehensive.
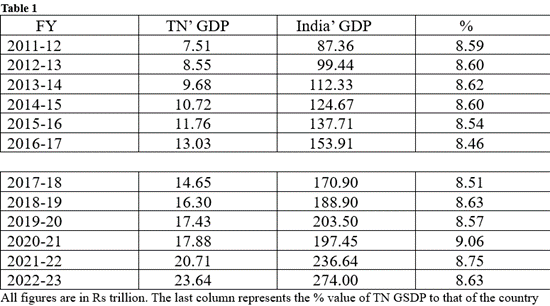
The first step is to contextualise the size of TN in the national economic map. This is done by comparing the state’ GDP to that of the country.
 Steady growth…
This table brings out that TN’s economy since 2011-12 has been almost at the same size relative to the national economy. TN appears to have neither grown faster nor fallen behind the decadal growth of the country though some minor variations exist in individual years. The nation’ and the state’ economic growth are like two trains moving in the same direction and at the same speed creating an illusion of stasis! Two parallel engines at work, not the politically popular double-engine!
Interestingly, this period of twelve years saw a record number of chief ministers at the helm in the state and may be attesting to the aspect that the state’ economy is both political-party and personality proof!
TN has received less from centre post GDP
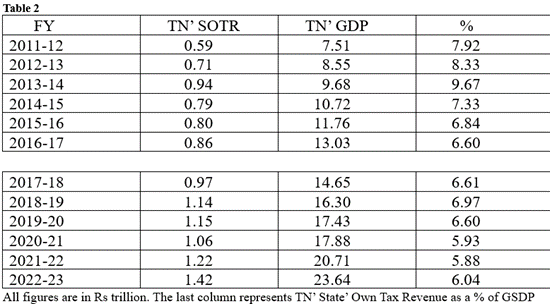
Table 2 brings out the fairly uneven pattern in the generation of tax revenue of the state (SOTR), which is noticeably higher in the initial years. The two segments of this table show a perceptible change in the SOTR’ trajectory in the post GST period leading to a logical inference that GST has not been revenue accretive to the state. Even in the pre-GST period some slowdown is evident post FY 2015.
This leads to the question whether TN alone lost the momentum under the GST regime or if it is a case of an overall faltering in the revenue potential of the new tax?
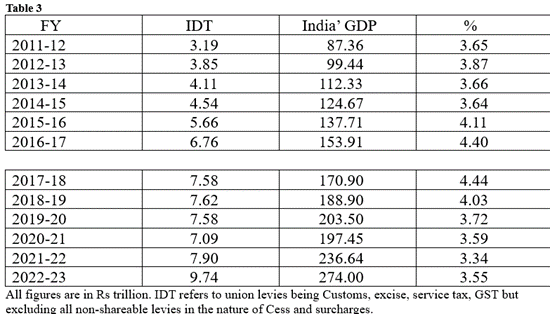 The Table 3 below seeks to answer the above question. The table captures the total of indirect taxes shown in the revenue budget of the union as a percentage of the GDP of the respective years.
For the purpose of this table the indirect tax kitty excludes all cesses and surcharges levied by the union as they are ad hoc in nature, not shared with the states and quite incongruent with the concept of the GST being the sole levy encompassing all indirect taxes other than the basic customs duty.
The data shows that GST has struggled to outperform the effective collection in the pre-2017 period. In fact, the ratio has been on a decline post 2017 indicating a poor revenue buoyancy of the same.
The monthly GST collection figures have been a cause for much celebration but it is important to contextualise with the revenue trend of the past period to assess the impact of the GST levy on the total tax pool. Once the figures for the current FY is announced in the upcoming union budget, the picture may acquire greater clarity.
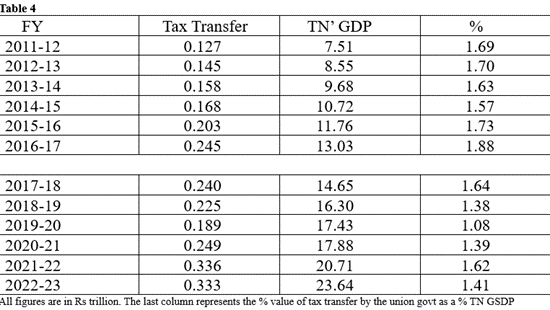 Table 4 is the crux of the controversy under consideration whether the revenue transfer from the union increased post 2014.
It can be seen that by mere efflux of time the absolute quantum of annual transfer has gone up, but relative to the state’ size the effective transfer has come down in the post GST period. The fall is quite precipitous in some years.
The claim of a higher transfer in the post-2014 period may not stack up with the above data.
TN may have been impacted on two counts. Its own GST collection has been low compared to the VAT/sales tax of the past, affecting the SOTR, coupled with the overall dip at the centre, affecting the quantum of its share of the national tax.
This in turn correlates to the sharp increase in the revenue deficit in the years post 2015-16 and the ballooning debt problem. When the present government took charge in 2021 in TN, it brought out a white paper on the fiscal situation in the state, and an extract from the said document is reproduced here-
“Business-as-usual cannot continue, and our approach must fundamentally change if we are to break out of this vicious cycle of increasing debt and interest costs. On the other hand, this is an opportunity to effect “once in a generation” reforms, many of which should have been undertaken years ago by any responsible Government.”
 Post the three state budgets already presented with just two remaining in the years 2024 and 2025, the question that arises is the commitment of this government to introduce any far-reaching fiscal reforms.
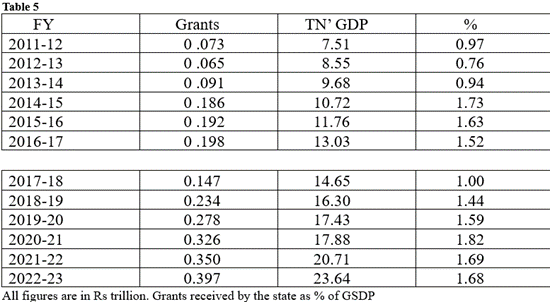
Just to complete the picture, the position on grants-in-aid from the centre is also shown in Table 5. This has shown a relative growth over time. But the grants are tied to specific project of the center implemented at the state and cannot be diverted to fund other expenses.
The subject of fiscal transfers will hold the centerstage in the upcoming 16th finance commission’ deliberations and hopefully an objective discussion would take place between all the constituents to address the concerns that keep frequenting the discussions between the states like TN and Kerala and the union finance ministry.
Note-
There may be errors in the data garnered from different sources and further reclassified for comparability. Readers may feel free to point out any such noticed which shall be duly corrected in the article. But the big picture is unlikely to change despite any such error.