The finance minister of Tamil Nadu placed in public domain a white paper on the state’s finances a few days before he presented his first budget for the year 2021-22. He has since presented his second budget for 2022-23.
Besides the forum of the state assembly, he being a very sought-after speaker has used every forum to catalogue all that is wrong with the state’s finances.
The medium-term plan appended to the budget of 2022-23 paints a picture of high growth in revenues and a contraction in expenses in the coming years, to arithmetically reach a comfortable level of deficits and debt by 2025-26. Even a wishful thinking should have a fictional plan to support it, but no such details can be discerned.
Time to walk the talk
The committee that attracted a lot attention comprised various global experts and Nobel laureates raising the expectation of some radical ideas and game-changing actions. The outcome is still awaited; it is only fair to expect regular updates on how the work is progressing in the spirit of transparency that the FM sets much store by.
The most recent one is the committee to look into the various aspects of the functioning of the GST and the issue of the state being denied a fair share of tax devolution due to the increasing dominance of non-shareable taxes levied by the Union government.
It is presumptuous to raise doubts on the utility of this exercise as the work of the committee is yet to start; but it is difficult not to speculate as to what can be effectively achieved as much of the action around GST is centred in the GST Council with an individual state like TN having no ability to change the course though no one is prevented from making suggestions.
To understand the plight of the state’s finances it is essential to look at the pressure points and appreciate what specifically ails the system. The picture gets starker as one sees it in comparison with a few others like states. The discussion below is based on data tabulated in the tables.
High fiscal deficit…
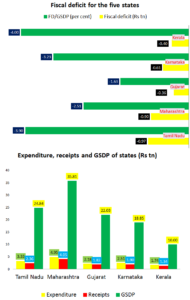
TN’ fiscal deficit is higher than that of Maharashtra, an economy almost 50 per cent bigger! Karnataka and Gujarat which are not very different in size than TN, have far smaller deficits.
Figure 1 provides the expenditure, receipts, fiscal deficit and GSDP of five states
A private enterprise with like financials would normally be accused of running a ponzi scheme but that would be an unfair allegation to throw at a state that has achieved many a milestone on social indicators and placed welfare right on top of the developmental agenda over several decades!
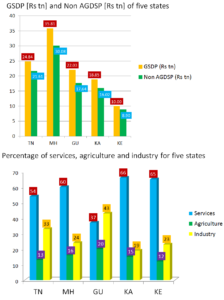
Figure 2 of the sectoral composition of the gross state domestic product (GSDP), helps to verify if any accentuated difference in the sectoral composition among the states is the cause of any specific tilt against TN. The advanced states have a greater bias on services and industry, which typically help tax revenue to flow in line with the economic activity. TN and the comparable states do not differ much.
The advent of GST has eroded an individual state’s discretion to levy taxes. The piquancy of how the states lack full suzerainty over their revenues to fund their public obligation is the heart of the problem in the fiscal management of the states.
Though the states’ own tax revenue (SOTR) includes the SGST collected by it, its discretion to adjust rates that existed under the VAT regime, has been lost to the collective decision-making with the Union government having an outsized influence. SGST is a mere arithmetical appropriation of a single tax levied under GST system, divided equally between the Union and the state.
Absence of buoyancy
TN has a clear problem as its SOTR as a proportion of the total receipts is the lowest and equally its lower proportion of SOTR to the non-agricultural GSDP, is reflective of the relative absence of tax buoyancy, where the growth in the economy is not correspondingly yielding revenue to the state.
TABLE 1 States own tax revenue and other receipts
| States | SOTR | Other revenues | Central transfers | SOTR/TR* (per cent) | SOTR/Non AGSDP (per cent) |
| Tamil Nadu | 1.42 | 0.21 | 0.73 | 60.16 | 6.57 |
| Maharashtra | 2.56 | 0.27 | 1.19 | 63.20 | 8.51 |
| Gujarat | 1.15 | 0.18 | 0.49 | 63.18 | 6.52 |
| Karnataka | 1.26 | 0.11 | 0.53 | 66.31 | 7.87 |
| Kerala | 0.74 | 0.12 | 0.48 | 55.22 | 8.31 |
* – Total receipts
The reason for excluding the agriculture component of the GSDP in this exercise is to correlate the revenue to the source economic activity, as agriculture is largely exempt from any form of taxation though some of its inputs may have a tax content.
Just to get a glimpse of the order of shortfall, if TN had the same proportion as Karnataka of SOTR to total revenue it should collect another Rs14,000 cr as taxes and if the same equation is done with Maharashtra’s SOTR of its adjusted GSDP, TN should collect another Rs 41,000 cr as taxes.
Neither of the above is a small number!
Yawning gap between potential and actual
The question that should haunt the FM and the officers of the state is the yawning gap between the potential of the economy and the actual realisation in taxes.
Table 2 brings home the fact that the share of GST in the SOTR of TN is way below that of comparable states. TN actually gets away with a robust collection of state excise on liquor and the much-criticised petro taxes still in the state domain.
TABLE 2 SOTR breakup
| States | GST | VAT+excise | Stamp regn | Vehicle tax | Elec tax | Misc | GST (per cent) |
| Tamil Nadu | 0.49 | 0.67 | 0.16 | 0.07 | 0.01 | 0.02 | 34.50 |
| Maharashtra | 1.19 | 0.72 | 0.32 | 0.10 | 0.11 | 0.12 | 46.48 |
| Gujarat | 0.53 | 0.31 | 0.13 | 0.05 | 0.10 | 0.03 | 46.08 |
| Karnataka | 0.53 | 0.47 | 0.15 | 0.08 | 0.03 | Neg | 42.06 |
| Kerala | 0.36 | 0.25 | 0.05 | 0.04 | NA | 0.04 | 48.64 |
It is also to be noted that TN is a bigger beneficiary of the GST compensation scheme which is likely to cease from 1 July this year upon the mandated five-year period completion, resulting in not an insignificant extra dent in the state’s finances.
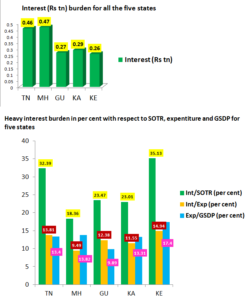
The most crucial issue for the state is the very high proportion of its revenue getting drained as interest payments. TN pays almost the same level of interest as Maharashtra which as mentioned earlier is a 50 per cent larger economy.
If the state cannot post-haste raise its revenue levels it needs to find an answer to its level of debt which at 26.29 per cent of the GSDP, though is lower than that of Karnataka, but surprisingly the latter pays much lower amount as interest.
Unlike private enterprises where the debt servicing is a combination of paying the principal and interest, for a sovereign it is more paying the interest and if the interest payment is kept within say 10 per cent or at worst below 15 per cent of the total receipts, then irrespective of the quantum, the debt will pose little problem. Having a higher revenue base allows to borrow more.
Figure 3 shows the heavy interest burden on all five states.
The other plank is usually expenditure rationalisation. The data of expenditure as a proportion of the GSDP shows that TN is no outlier putting paid to the idea that the state outspends others for better outcomes. Kerala leads by a good distance.
TN should seek its expert group solutions to aggressively raise annual revenue flow by the state’s own efforts and, as a second prong, look for a quick fix to reduce the costly debt that must be distorting the total interest outgo.
The second point above takes us to the title of the article.
Over Rs 60,000 crore value of investment in Titan
Four decades ago, in 1984, the state would have little realised that it was buying a ‘golden goose’ when it signed its JV agreement with a company to produce what was then a non-essential and perhaps a luxury item, wrist watches!
The 27.88 per cent share that TIDCO, the state vehicle for promoting investments, holds in Titan Industries carries a ball park market value of Rs 61,000 crore; and as a strategic holding it should get a reasonable premium.
It is the good karma that successive CMs did not seek to cash this as the exercise could have also carried collateral advantages. Anyway, the stratospheric value is more a recent occurrence.
Only time will reveal whether this investment which currently yields 0.16 per cent is a golden goose or a golden handcuff as the partner in the venture may find it difficult to exercise the first offer of buying given the cost involved but would certainly not wish to lose control of a crown jewel which has created more value for investors than their much bigger giants making trucks and steel!
This is more to illustrate that the state may not be without options to raise one-time resources and bring the debt to more reasonable levels which will also help reduce the cost of future debt in a rising interest rate scenario.
The state needs to act swiftly and the FM with his rich investment banking experience is best placed to take objective decisions that optimise the long-term interest of the state.


